
Ray 集群原理
Ray 是为分布式 Python 应用设计的执行框架,核心抽象是两类:
- Task无状态远程函数,通过
@ray.remote装饰,调用产生 ObjectRef(future) - Actor有状态远程对象,每个 actor 实例对应一个 worker 进程,生命周期独立于调用方
Ray 集群架构
整个集群运行的是一组协作的进程,不是单一守护进程。理解 Ray 的关键是分清控制平面与数据平面。
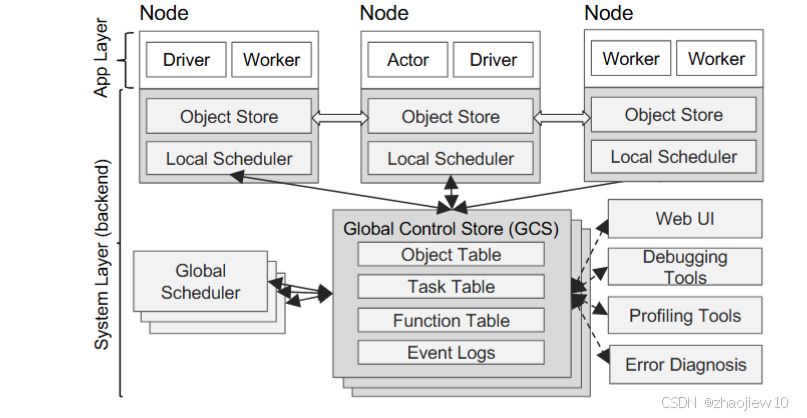
控制平面组件包括
- GCS (Global Control Service) :集群元数据中心,只在 head 节点上有一个。它存储 actor 注册表、节点列表、资源使用情况、placement group 状态、命名空间等。GCS 不承载用户数据对象。默认监听 head 节点的
--port参数,部署文档里通常是 6379(继承自早期 Redis 实现的端口约定,现在 GCS 已经是独立 C++ server 不再依赖 Redis)。 - Raylet :每节点一个。它是本地的“小调度器+本地对象存储接口”。职责包括:接收来自 driver/worker 的任务请求、调度到本节点的 worker、与 GCS 心跳、向 GCS 报告本节点资源、协调跨节点对象传输。Raylet 用 gRPC 监听端口由系统动态分配。
- Object Store (Plasma) :每节点一个,基于共享内存的对象存储。所有 ray task 的入参和返回值都过 plasma。跨节点取对象时,本地 raylet 向远端 raylet 发 gRPC,数据走 TCP。默认占节点可用内存的 30%,用文件 socket 给本机进程。
- Dashboard :web UI,只在 head 节点起,默认 8265。HTTP/aiohttp,实时拉 GCS 数据并渲染。
- Dashboard Agent :每节点一个。它干两件事:采集本节点的 system + Ray internal 指标并暴露 Prometheus
/metrics端点;以及作为 dashboard 后端的代理(转发本节点 actor logs 等)。后面“指标集成”章节会反复指向这个组件。 - Log Monitor :head 节点一个,聚合所有节点的 worker stderr/stdout 流。
数据平面:
- Driver :用户调用
ray.init()的进程 - Worker :Raylet fork 出来执行 task 或承载 actor 实例的进程
import ray
ray.init()                           # 连接已有集群,或本地起单节点# Task: 无状态远程函数,调用即提交,返回 ObjectRef
@ray.remote(num_cpus=2, num_gpus=1)
def compute(x: float) -> float:import torcht = torch.tensor(x).cuda()return float((t * t).item())future = compute.remote(3.14)        # 立即返回,在某个节点的 worker 上异步执行
result = ray.get(future)             # 阻塞拿结果# Actor: 有状态远程对象,生命周期独立,持有自己的 worker 进程
@ray.remote(num_gpus=1)
class ModelServer:def __init__(self, model_path: str):self.model = load(model_path) # 模型只加载一次,常驻显存def infer(self, prompt: str) -> str:return self.model.generate(prompt)server = ModelServer.remote("/data/model/Qwen2.5-7B-Instruct")
out = ray.get(server.infer.remote("你好"))
Ray 资源调度
资源是 Ray 调度的核心抽象。每个节点声明一组资源({"CPU": 8, "GPU": 1, "node:172.31.40.36": 1, ...}),task/actor 用 @ray.remote(num_gpus=1, num_cpus=2) 申请。Ray 不强制硬隔离资源:CPU 资源是纯粹的会计单位(不限制进程实际用多少核),GPU 资源通过设置 worker 的 CUDA_VISIBLE_DEVICES 实现软隔离。资源是逻辑层语义,真实使用情况由用户代码自律。
placement group 是 Ray 多卡训练/推理的关键调度原语。它一次性向集群申请一组 bundle(每个 bundle 是一份资源,如 1 GPU + 4 CPU),要么全部成功 (gang-scheduling) 要么全部失败,从而保证多卡协同任务不会出现部分卡 ready 的死锁。STRICT_PACK 策略要求一组 bundle 落在同一节点,这是 vLLM 给 TP workers 用的策略,目的是让 AllReduce 走节点内 NVLink。
placement group 申请一组 gang-scheduled 资源
from ray.util.placement_group import placement_group
from ray.util.scheduling_strategies import PlacementGroupSchedulingStrategy# 申请 4 个 bundle,每个 1 GPU + 4 CPU,STRICT_PACK 强制同节点
pg = placement_group(bundles=[{"GPU": 1, "CPU": 4}] * 4,strategy="STRICT_PACK",
)
ray.get(pg.ready())                  # 阻塞直到 4 个 bundle 全部拿到资源# 在 placement group 上调度 4 个 worker actor,每个钉一个 bundle
workers = [Worker.options(scheduling_strategy=PlacementGroupSchedulingStrategy(placement_group=pg,placement_group_bundle_index=i,)).remote()for i in range(4)
]
Ray 启动过程详解
执行 ray start --head --port=6379 --dashboard-host=0.0.0.0 --dashboard-port=8265 后,启动器(Python 脚本)按顺序拉起一连串子进程,每个进程在 session 目录下留下 stdout/stderr 文件供事后排查。
- 创建 session 目录
/tmp/ray/session_<timestamp>_<pid>,并创建 symlink/tmp/ray/session_latest指向它。session 目录里会有logs/、sockets/、metrics/等子目录。 - 启动 GCS server :独立 C++ 二进制
gcs_server,监听--port(本例 6379)。日志写到logs/gcs_server.{out,err}。 - 启动 Object Store (plasma) :在
sockets/plasma_store上 listen Unix socket,本机所有 worker/driver 都走它通信。 - 启动 Raylet :C++ 二进制,在
sockets/raylet上 listen Unix socket,同时起 gRPC server 监听一个动态端口(对外暴露给跨节点通信)。Raylet 启动后立刻向 GCS 注册本节点,提交本节点声明的资源。 - 启动 Dashboard :Python aiohttp server,监听
--dashboard-host:--dashboard-port(本例 0.0.0.0:8265)。Dashboard 是 Ray 的运维和调试中枢:从 GCS 拉集群元数据、节点列表、actor 注册表,从各节点的 Dashboard Agent 拉系统/进程级实时指标,从 Log Monitor 订阅聚合后的 worker 日志流,最终在浏览器里渲染成集群概览、节点健康状态、actor/task 详情、worker 日志实时滚动、内存/CPU profiling、placement group 状态等界面。所有调试信息都从这一个端口出,不需要 SSH 到各节点 grep 日志。后面接 Grafana 用的也是 Dashboard 提供的 iframe 嵌入能力。 - 启动 Dashboard Agent :Python 进程,本身是 dashboard 的“边车”,同时也是 metrics agent。它在动态分配的端口上暴露
/metrics,把本节点 raylet/worker/system 指标用 Prometheus 格式吐出。head 节点这台机器实际跑的不止一个 metrics agent,因为 head 同时还有 GCS、autoscaler 等组件,各自暴露独立 metrics 端点。 - 启动 PrometheusServiceDiscoveryWriter(仅 head 节点) :守护线程,不是独立进程,跑在 dashboard 进程内。每 5 秒调用
ray.nodes()列出 alive 节点,聚合它们的 metrics 端口,原子写入/tmp/ray/prom_metrics_service_discovery.json。 - 启动 Log Monitor :每个节点一个 Python 进程,tail 本节点
logs/下所有 worker stdout/stderr 文件,把新增内容转给 Dashboard(head 节点的 Dashboard 进程订阅这些日志流,再转给浏览器实时滚动)。 - 生成默认 Prometheus 配置(仅 head 节点) :把模板渲染到
<session_dir>/metrics/prometheus/prometheus.yml,内容是一个最小 file_sd 配置,job_name=ray,files 指向第 7 步写的 JSON。
Dashboard / Dashboard Agent / Log Monitor / GCS / Raylet 之间的关系如下图所示
- Dashboard 是消费者,自己不采数据,全部从 GCS / Dashboard Agent / Log Monitor 拉。
- Dashboard Agent 同时服务两类用户:上行给 Dashboard 拉状态(HTTP 内部 API),下行给 Prometheus 抓
/metrics(同一个端口的不同路径)。 - Log Monitor 是 push 模型,主动把新增日志推给 Dashboard,浏览器看到的实时滚动日志就来自这条链路。
- 所有 metrics 端口都是动态分配的,所以非得用
prom_metrics_service_discovery.json这种文件 SD 机制,而不能像传统监控那样硬编码 IP:Port。
worker 节点执行 ray start --address=<head>:<port> 时流程更简单:
- 解析 head GCS 地址,建立 gRPC 连接
- 在本机起 plasma + raylet + dashboard agent + log monitor
- raylet 向 head GCS 注册本节点资源
- head 节点的 ServiceDiscoveryWriter 在下一个 5 秒周期会自动把这个新 worker 的 metrics 端口加入 SD 文件
ray stop 命令反向遍历这些进程,逐个发 SIGTERM。注意:ray metrics launch-prometheus 启动的 prometheus 进程不是 ray 进程组的成员,ray stop 不会停它。
启动后从 driver 看到的节点信息
>>> import ray
>>> ray.init(address="172.31.40.36:6379")
>>> ray.nodes()
[{"NodeID": "11b174415dd5860bc4be43575c5a400c108ae4738d2ff16a05e5b61a","Alive": True,"NodeManagerAddress": "172.31.40.36","NodeManagerPort": 36789,"MetricsExportPort": 44217,           # 这就是 SD 文件里 prometheus 抓取的端口"Resources": {"CPU": 8.0,"GPU": 1.0,"memory": 21587656704,"node:172.31.40.36": 1.0,           # 自动注册的 node:<ip> 资源"node:__internal_head__": 1.0,"object_store_memory": 9252702208,},...}
]
PrometheusServiceDiscoveryWriter 的工作就是把这个列表里每个 alive 节点的 NodeManagerAddress + MetricsExportPort 拼成 SD JSON 写盘。
Tensor Parallel 与 Pipeline Parallel
两种并行方式对网络的依赖差异巨大,这是后面 vLLM 部署决策的理论基础。
Tensor Parallel (TP) 把单层权重横向切开,每个 GPU 持有一片。前向传播时,每层 attention 之后和 MLP 之后都要一次 AllReduce :所有参与 TP 的 GPU 把各自的 partial result 加和回所有人。一个 70B 模型 80 层、每层至少 2 次 AllReduce,意味着每个 token 的前向就要 160 次 AllReduce。通信量 ∝ hidden_size × batch × seq_len。AllReduce 对带宽和延迟都极度敏感。
Pipeline Parallel (PP) 把模型按 layer 划成多个 stage,每个 GPU 持有连续的若干层。前向传播在 stage 边界做 send/recv,只传 activation。通信量小、稀疏,容忍较低带宽。
带宽量级对比:
- NVLink 4 (节点内 H100 直连):900 GB/s,微秒级延迟
- NVSwitch (8 卡 all-to-all):900 GB/s
- InfiniBand NDR(节点间 RDMA):~50 GB/s,毫秒级延迟
- 100 Gb 以太网:~12 GB/s
跨节点带宽比节点内 NVLink 慢 20–100 倍。TP 跨节点的代价是把每层那 160 次 AllReduce 放到慢 20 倍的链路上,GPU 大部分时间在等通信。因此原则上TP 永远不出节点,PP 用来跨节点。如果模型太大单节点装不下,就 TP=节点 GPU 数 + PP=节点数。
TP 切的是同一层的 weight,每个 GPU 持有列方向的一片,前向时各自算自己的 partial 输出,然后用 AllReduce 把所有人的结果加和回来:
PP 切的是 layer,每个 GPU(或每组 TP GPU)持有连续的若干层,整个前向只在 stage 边界 send/recv 一次 activation:
实际生产部署常常 TP 和 PP 同时用 :节点内 TP 跑 NVLink AllReduce,跨节点 PP 跑 InfiniBand send/recv:
TP 通信频次 ∝ 层数,且每次通信量正比于 hidden × batch × seq;PP 通信频次 = 节点数 - 1,每次只传 stage 边界的 activation。这就是为什么 TP 容忍不了跨节点的网络延迟,而 PP 在 InfiniBand 甚至万兆以太网上都能跑得动。
vLLM 与 Ray 的关系
vLLM 是 LLM 推理引擎,核心技术是 PagedAttention(把 KV cache 切成固定大小的 page,像虚拟内存一样管理)和 continuous batching(token 级别的连续批处理,而不是 request 级别)。它本身有完整的执行能力。而Ray 是分布式执行框架。
vLLM是否需要Ray?
单节点推理根本不需要 Ray:
- 单 GPU:vLLM 直接跑
- 单节点多 GPU(TP ≤ 节点 GPU 数):vLLM 默认用 Python
multiprocessing,fork 出 TP worker 进程,通过共享 GPU 进行 NCCL 通信
只有当 TP × PP > 单节点 GPU 数时,才必须跨节点,这时 vLLM 用 Ray 作为 distributed executor。
vLLM 的启动参数 --distributed-executor-backend 有四个选择:
mp:multiprocessing,只能单节点ray:Ray actors,跨节点external_launcher:外部启动器(如 torchrun),跨节点但不通过 Ray 调度auto:检测到 Ray 集群环境就用 ray,否则 mp
当 backend 是 ray 时,vLLM 内部干这些事:
- 调用
ray.util.placement_group(bundles=[{"GPU": 1, "CPU": N}] × (TP × PP), strategy="STRICT_PACK")申请一组 bundle。STRICT_PACK表示同 PP rank 内的 TP workers 必须塞在同一节点(为了让 TP AllReduce 走 NVLink)。 - 等 placement group ready(gang-scheduled,要么所有 bundle 都拿到资源,要么全部排队)。
- 用
placement_group_capture_child_tasks=True创建 worker actors,每个 actor 钉在一个 bundle 上,actor 内部初始化 NCCL communicator。 - Driver(API server 进程)持有所有 worker 的 actor handle。一个推理请求到来时,driver 把 prompt token broadcast 给所有 worker,worker 各自做 forward,通过 NCCL 直接通信(不经过 Ray),最后 TP rank 0 把结果返给 driver。
- Ray 在这套架构里只负责“进程编排” :帮 vLLM 在多节点上把进程拉起来、钉到正确的 GPU 上、提供故障重启钩子,实际推理时通信走 NCCL。
理解这一点对调试很关键:vLLM 卡死时,如果是 actor 启动慢/不齐,看 Ray placement group 状态;如果是 forward 时 hang,看 NCCL 日志(NCCL_DEBUG=INFO)。
vLLM 也不会“参与” Ray 的 metrics 体系 :即使在 Ray cluster 里跑,vLLM 自己的 /metrics 端点也不会被 Ray 的 service discovery 发现。
三种典型规模对应的实际命令如下
# 1. 单 GPU,vLLM 直接跑(不需要 Ray)
vllm serve Qwen/Qwen2.5-7B-Instruct# 2. 单节点 4 GPU,vLLM 用 multiprocessing(也不需要 Ray)
vllm serve Qwen/Qwen2.5-32B-Instruct \--tensor-parallel-size 4# 3. 2 节点 × 8 GPU,必须用 Ray
ray start --head --port=6379                    # 在 node 0
ray start --address='<head-ip>:6379'            # 在 node 1
vllm serve deepseek-ai/DeepSeek-R1 \            # 在 node 0--tensor-parallel-size 8 \--pipeline-parallel-size 2 \--distributed-executor-backend ray
TP+PP 跨节点场景
TP+PP 跨节点是最复杂的场景
起 Ray 集群
Node 0 起 head
$ ray start --head --port=6379 --dashboard-host=0.0.0.0
Local node IP: 10.0.0.1
--------------------
Ray runtime started.
--------------------
Next stepsTo add another node to this Ray cluster, runray start --address='10.0.0.1:6379'
在 Node 0 上拉起 GCS(端口 6379)、Dashboard、本节点 Raylet、Dashboard Agent、PrometheusServiceDiscoveryWriter、Log Monitor。同时 ray start 进程会写一个文件 /tmp/ray/ray_current_cluster,内容是本机 GCS 地址,后面 vLLM 自动发现集群要用到。
Node 1 加入
$ ray start --address='10.0.0.1:6379'
Local node IP: 10.0.0.2
--------------------
Ray runtime started.
--------------------
--address 告诉本节点 Raylet “去这个 GCS 注册自己”。Raylet 启动后立刻向 10.0.0.1:6379 上报本节点资源(8 CPU、8 GPU、若干内存),GCS 把这条记录加入 cluster state。head 节点的 PrometheusServiceDiscoveryWriter 在下一个 5 秒周期就把 Node 1 的 metrics 端口加进 SD 文件,prometheus 自动追踪。
在 Node 0 上 ray status 验证集群已聚合,16.0 GPU 就是两节点 GPU 资源在 GCS 里的聚合视图。
$ ray status
======== Autoscaler status ========
Node status
-----------
Active:1 node_xxx  (10.0.0.1)1 node_yyy  (10.0.0.2)
Resources
---------
Total Usage:0.0/16.0 CPU0.0/16.0 GPU0B/240GiB memory
vLLM 怎么知道 Ray 集群存在
vllm serve --distributed-executor-backend=ray 启动时,vLLM 内部调用 ray.init()。ray.init() 的 cluster 发现顺序:
- 显式
address=参数(vLLM 不传) - 环境变量
RAY_ADDRESS(export RAY_ADDRESS=auto是常见手动指定方式) - 本机文件
/tmp/ray/ray_current_cluster:ray start自动写入,里面是 GCS 地址 - 都没有的话,起一个本地的 single-node 集群
步骤 3 是 vLLM 多节点部署用的:在 Node 0 上跑 vllm serve 时,/tmp/ray/ray_current_cluster 文件已经在那(ray start --head 写的),ray.init() 自动连到这个已有集群,不会再起新集群。如果在 Node 1(worker 节点)跑 vllm 也行 :它的 /tmp/ray/ray_current_cluster 由 ray start --address=... 写入,指向 Node 0 的 GCS,连过去仍然访问到同一个集群。但生产里永远在 head 节点跑 driver,因为 driver 持有所有 worker actor handle,head 离 GCS 最近,latency 最低。
如果是2节点16卡的环境,placement group 怎么把 16 个 worker 派到 16 块卡上?vLLM 拿到 cluster handle 后调用 placement group API。Ray scheduler 看到 16 个 bundle、STRICT_PACK 策略、两个节点各 8 GPU 的实际 topology,会自然排出:
- PP rank 0 的 TP 0-7 → Node 0 的 GPU 0-7(NVLink 全连)
- PP rank 1 的 TP 0-7 → Node 1 的 GPU 0-7(NVLink 全连)
这样 TP 的 AllReduce 走节点内 NVLink,PP 的 send/recv 走节点间 InfiniBand。
整个流程如下
Prometheus 指标集成原理
Ray 内部 metrics 是怎么产生的?
Ray 用 OpenCensus / OpenTelemetry 在每个进程内累积指标。CPU 利用率、内存、object store 占用、actor 数量等系统指标由 raylet 采集;task 调度延迟、submit 速率等内部指标由 GCS 上报;用户在代码里 ray.util.metrics.Counter(...) 自定义的指标由 worker 上报。
每个进程的指标周期性 flush 给本节点的 Dashboard Agent。Dashboard Agent 在本节点动态分配端口,起 HTTP server,在 /metrics 端点用 Prometheus 文本格式暴露聚合后的指标。head 节点上往往有多个 metrics 端点(分别属于 raylet、autoscaler、dashboard 等),所以 SD 文件里会看到同一 IP 的多个 port:
ray http://172.31.40.36:42039/metrics up
ray http://172.31.40.36:44217/metrics up
ray http://172.31.40.36:44227/metrics up
最小的 Ray 自定义 metric 示例如下
import ray
from ray.util.metrics import Counter, Histogramray.init()@ray.remote
class MyService:def __init__(self):# metric 在 actor 进程内累积,通过本节点的 dashboard agent 暴露self.requests = Counter("my_service_requests_total",description="Number of requests",tag_keys=("status",),)self.latency = Histogram("my_service_latency_seconds",boundaries=[0.01, 0.1, 1.0, 10.0],)def handle(self, req):import timet0 = time.time()result = process(req)self.latency.observe(time.time() - t0)self.requests.inc(1.0, tags={"status": "ok"})return resultsvc = MyService.remote()
ray.get(svc.handle.remote("hello"))
metric 名 my_service_requests_total 会自动出现在本节点 Dashboard Agent 的 /metrics 端点,然后被 SD 文件里登记的 prometheus job 抓走,在 Grafana 里直接 PromQL 查得到。
Ray service discovery 文件机制
Head 节点的 PrometheusServiceDiscoveryWriter(运行在 dashboard 进程内的守护线程)做这件事:
- 调用
ray.nodes()拿到 alive 节点列表 - 对每个节点收集
NodeManagerAddress和MetricsExportPort(raylet 已经在 GCS 注册了这些端口) - 拼成 SD JSON,原子写到
/tmp/ray/prom_metrics_service_discovery.json - 每 5 秒重复一次
写文件用 atomic rename(写到 .tmp 再 rename),Prometheus 通过 inotify 监听文件变化,新内容生效不需要重启 prometheus。
集群伸缩(节点上下线、autoscaler 扩缩)时,SD 文件下一个周期就会更新,新节点的 metrics 端点自动被 prometheus 抓取。
vLLM 是怎么暴露指标的
vLLM 的 OpenAI-compatible server 是基于 FastAPI + uvicorn 的 HTTP 服务。它用两条途径产指标:
prometheus_client库:在引擎核心(scheduler、cache manager 等)埋点,所有 metric name 以vllm:开头(比如vllm:num_requests_running、vllm:prompt_tokens_total、vllm:gpu_cache_usage_perc)prometheus-fastapi-instrumentator:自动给所有 HTTP route 加上耗时和错误率指标
这些指标在 vLLM API server 进程内累积,通过统一的 /metrics route(prometheus_client 的标准 ASGI handler)暴露。vLLM API server 监听的端口由用户启动参数 --port 决定,本例是 8000。
直接 curl vLLM 的 /metrics 端点看到的就是 Prometheus 标准文本格式:
# HELP vllm:num_requests_running Number of requests currently running on GPU.
# TYPE vllm:num_requests_running gauge
vllm:num_requests_running{engine="0",model_name="..."} 3.0# HELP vllm:prompt_tokens_total Total number of prefill tokens processed.
# TYPE vllm:prompt_tokens_total counter
vllm:prompt_tokens_total{engine="0",model_name="..."} 12450.0# HELP vllm:time_to_first_token_seconds Time to first token in seconds.
# TYPE vllm:time_to_first_token_seconds histogram
vllm:time_to_first_token_seconds_bucket{le="0.1",...} 8.0
vllm:time_to_first_token_seconds_bucket{le="0.5",...} 24.0
...
注意这里的 metric 命名空间是 vllm:,与 Ray 的 ray_* 完全不冲突,Prometheus 抓回来后两套指标在同一个 TSDB 里和平共处,Grafana 用 PromQL 各自查询即可。
为什么 vLLM 不能用 Ray 的 SD
vLLM 即使在 Ray 集群里运行,它的 API server 进程不会把自己的 /metrics 端口注册到 Ray 的 SD 文件。原因有两个:
- vLLM API server 是通过
vllm serve ...CLI 直接启动的普通 Python 进程,不是 Ray actor。它没在 Ray GCS 注册过自己。 - 即使 vLLM 把推理 worker 通过 Ray actor 跑起来(当 backend=ray 时),那也只是 worker actor,不是 metrics endpoint;vLLM 没有把 API server 的端口告诉 Ray 的接口。
所以集成方式是让 Prometheus 同时持有两个 job:
job: ray用file_sd_configs跟 SD 文件,自动追踪 Ray 节点job: vllm用static_configs写死localhost:8000抓 vLLM
示意图如下
部署实战
版本探查
先确认 GPU 实例的基线环境。本部署用的是 Deep Learning OSS Nvidia Driver AMI GPU PyTorch 2.7(Ubuntu 22.04),登入后做基线 inventory
- DLAMI 用了双 Python:系统 Python 3.10 + venv Python 3.12,所有 pip install 必须先
source /opt/pytorch/bin/activate,否则装到了系统 site-packages 里跑不起来 PyTorch 应用。 - venv 里的 PyTorch 2.7.0+cu128 已经预装好;后面 vLLM 安装会强制升级到 torch 2.11.0+cu130,这是预期的副作用。
- L4 24 GB 实测可用 23034 MiB(被驱动和 ECC 等占了一点),后面算 KV cache 预算时按 23 GB 估算。
- 驱动 580.126.09 同时支持 CUDA 12.8 和 13.0 runtime,所以 vLLM 升级 CUDA 13 stack 后仍然可用。
$ lsb_release -a
Distributor ID: Ubuntu
Description:    Ubuntu 22.04.5 LTS$ python3 --version           # 系统 Python
Python 3.10.12$ ls /opt/                    # 看 DLAMI 预装的组件
amazon  aws  containerd  dlami  nvidia  pytorch$ source /opt/pytorch/bin/activate    # 激活 DLAMI 自带的 venv
$ python --version
Python 3.12.10$ python -c 'import torch; print(torch.__version__,torch.cuda.is_available(),torch.cuda.get_device_name(0))'
2.7.0+cu128 True NVIDIA L4$ nvidia-smi --query-gpu=name,memory.total,driver_version --format=csv
name, memory.total [MiB], driver_version
NVIDIA L4, 23034 MiB, 580.126.09$ nvcc --version | tail -1
Build cuda_12.8.r12.8/compiler.35583870_0
Ray 安装与启动
安装Ray,[data,train,tune,serve] 这几个 extra 各自的作用对应“概念”章节里 Ray 的不同子库:data 是分布式数据加载、train 是分布式训练 API、tune 是超参搜索、serve 是模型服务。本场景只用核心调度功能,serve 略多余。
source /opt/pytorch/bin/activate
pip install -U "ray[data,train,tune,serve]"
启动 head:
ray start --head --port=6379 --dashboard-host=0.0.0.0 --dashboard-port=8265
启动日志里几条关键信息:
INFO scripts.py:940 -- Local node IP: 172.31.40.36
SUCC scripts.py:980 -- Ray runtime started.
INFO scripts.py:1046 --   172.31.40.36:8265
ray status 显示资源已注册:
Total Usage:0.0/8.0 CPU0.0/1.0 GPU0B/20.10GiB memory0B/8.61GiB object_store_memory
8 vCPU 和 1 GPU 分别对应 g6.2xlarge 的硬件,memory 20GiB 是 Ray 给 worker 的内存预算(机器 30GB 减掉给 plasma 和系统的部分)。

这里不需要单独启动 worker:本部署只有一台机器进行示例测试,ray start --head 在这台机上同时拉起 GCS、Dashboard、Raylet、Dashboard Agent、Log Monitor 全套组件,head 节点本身就承担 worker 角色,能调度 task、承载 actor、暴露 1 GPU 资源。ray start --address='<head-ip>:6379' 只在多节点场景用,本部署用不到。后面 vLLM 起 --tensor-parallel-size=1 也只占用本节点的 1 GPU,不涉及跨节点调度。
/api/version 返回:
{"version": "4", "ray_version": "2.55.1", "ray_commit": "237c2455...","session_name": "session_2026-05-25_04-21-44_212632_2594"}
session 名跟磁盘上的目录对应,日志在 /tmp/ray/session_latest/logs/。
vLLM 安装
pip install -U vllm
这一步带来一个副作用:vLLM 会把底层 PyTorch 强升到它锁定的版本。本例 vLLM 0.21.0 把 torch 从 2.7.0+cu128 升到 2.11.0+cu130(注意 CUDA 字串从 cu128 变成 cu130,即 CUDA 12.8 升到 13.0 runtime),同时升级了 torchvision、整个 nvidia-* CUDA 13 stack、引入了 transformers 5.9.0。
pip 报了一个依赖冲突的 warning:
ERROR: pip's dependency resolver does not currently take into account all the packages
that are installed. This behaviour is the source of the following dependency conflicts.
opentelemetry-exporter-prometheus 0.62b1 requires opentelemetry-sdk~=1.41.1, but you
have opentelemetry-sdk 1.42.1 which is incompatible.
这个冲突来自 Ray 的 OpenTelemetry exporter 锁的 SDK 版本和 vLLM 拉的版本不一致。实测不致命,Ray 仍然能正常 export metrics。但这种环境污染对生产部署是隐患,正确的做法是 vLLM 单独装在独立 venv,不要污染 DLAMI 默认 PyTorch 环境。
CUDA 兼容性方面:L4 配的驱动 580.126.09 同时支持 CUDA 12.8 和 13.0 runtime,所以升级后测试仍旧通过:
import torch
print(torch.__version__)              # 2.11.0+cu130
print(torch.cuda.is_available())      # True
print(torch.cuda.get_device_name(0))  # NVIDIA L4
x = torch.randn(1000, 1000).cuda()
y = x @ x  # OK
模型下载
用 Qwen2.5-7B-Instruct(BF16 ≈ 15 GB):
sudo mkdir -p /data/model && sudo chown ubuntu:ubuntu /data/model
nohup hf download Qwen/Qwen2.5-7B-Instruct \--local-dir /data/model/Qwen2.5-7B-Instruct \> /tmp/hf_download.log 2>&1 < /dev/null &
下载日志显示约 2 分钟完成 14 个文件共 15 GB:
Fetching 14 files:   7%|          | 1/14 [00:00<00:03,  4.21it/s]
Fetching 14 files:  50%|          | 7/14 [01:59<02:05, 17.90s/it]
Fetching 14 files: 100%|##########| 14/14 [02:00<00:00,  8.58s/it]
Downloaded
vLLM 启动
启动命令
export MODEL_PATH=/data/model/Qwen2.5-7B-Instruct
nohup vllm serve $MODEL_PATH \--tensor-parallel-size 1 \--max-model-len 8192 \--gpu-memory-utilization 0.9 \--port 8000 \--host 0.0.0.0 \> /tmp/vllm.log 2>&1 < /dev/null &
--tensor-parallel-size 必须改成 1,g6.2xlarge 只有 1 块 GPU,TP=8 需要 8 块。vLLM 单 GPU 直接跑,不需要 Ray,backend 自动选 mp。
--max-model-len 要从 65536 降到 8192,L4 24 GB 显存,Qwen2.5-7B BF16 权重占 14 GB,加上 cudagraph buffer 和编译产物,留给 KV cache 大概 6-8 GB。Qwen2.5-7B 的每 token KV 大小约 0.5 MB(32 层 × 32 头 × 128 head_dim × 2 (K/V) × 2 字节),6 GB 装得下约 12000 token,留出余量后 8192 是安全选择。
vLLM 启动日志展示了从模型加载到服务就绪的完整过程:
[utils.py:240] non-default args: {'model_tag': '/data/model/Qwen2.5-7B-Instruct','host': '0.0.0.0', 'max_model_len': 8192,'gpu_memory_utilization': 0.9}
[model.py:568] Resolved architecture: Qwen2ForCausalLM
[parallel_state.py:1410] world_size=1 rank=0 local_rank=0
[gpu_model_runner.py:4857] Starting to load model /data/model/Qwen2.5-7B-Instruct...
[cuda.py:372] Using FLASH_ATTN attention backend
[weight_utils.py:938] Filesystem type: EXT4. Checkpoint size: 14.19 GiB. Available RAM: 25.41 GiB.
Loading safetensors checkpoint shards: 100% Completed | 4/4 [00:09<00:00,  2.34s/it]
[default_loader.py:397] Loading weights took 9.48 seconds
[gpu_model_runner.py:4959] Model loading took 14.29 GiB memory and 9.79 seconds
[backends.py:1148] Dynamo bytecode transform time: 4.46 s
[backends.py:393] Compiling a graph for compile range (1, 2048) takes 9.94 s
[monitor.py:53] torch.compile took 16.90 s in total
[monitor.py:81] Initial profiling/warmup run took 1.66 s
INFO:     Application startup complete.
启动总耗时约 50 秒:模型加载 10 秒、torch.compile 17 秒、cudagraph capture + warmup 若干秒、API server 启动若干秒。后续重启同模型,torch.compile 会从 ~/.cache/vllm/torch_compile_cache/ 读缓存,启动时间能压缩到 15 秒。
推理验证用 OpenAI 兼容接口:
curl -s http://localhost:8000/v1/chat/completions \-H 'Content-Type: application/json' \-d '{"model":"/data/model/Qwen2.5-7B-Instruct","messages":[{"role":"user","content":"用一句话介绍 Ray 是什么"}],"max_tokens":80}'
返回:
{"choices": [{"message": {"role": "assistant","content": "Ray 是一个开源的分布式计算框架,用于构建可扩展的应用程序。"},"finish_reason": "stop"}],"usage": {"prompt_tokens": 35, "completion_tokens": 17, "total_tokens": 52}
}
/metrics 端点验证(对应“概念-三方指标集成”里 vLLM metrics 链路):
vllm:estimated_flops_per_gpu_total{engine="0",model_name="..."} 0.0
vllm:num_requests_running{engine="0",model_name="..."} 0.0
vllm:num_requests_waiting{engine="0",model_name="..."} 0.0
让 vLLM 接入 Ray Executor
本部署单 GPU 默认走 mp backend,前面 vLLM 启动日志里完全看不到 Ray 痕迹(只有 world_size=1 rank=0,所有动作都在 EngineCore 进程内)。这一节演示如何手动让 vLLM 走 Ray executor,纯粹为了验证架构 ,单 GPU 用 Ray 是 overkil,生产请用默认 mp。
加 --distributed-executor-backend ray 重启:
source /opt/pytorch/bin/activate
nohup vllm serve $MODEL_PATH \--tensor-parallel-size 1 \--max-model-len 8192 \--gpu-memory-utilization 0.9 \--port 8000 --host 0.0.0.0 \--distributed-executor-backend ray \> /tmp/vllm-ray.log 2>&1 < /dev/null &
启动日志里能看到对应"概念-vLLM 与 Ray 的关系"里 ray.init() 发现机制的实际证据:
[utils.py:240] non-default args: {..., 'distributed_executor_backend': 'ray', ...}
worker.py:1814 -- Connecting to existing Ray cluster at address: 172.31.40.36:6379...
worker.py:2003 -- Connected to Ray cluster. View the dashboard at http://172.31.40.36:8265
ray_utils.py:621 -- No current placement group found. Creating a new placement group.
(RayWorkerProc pid=16845) (Worker pid=16845) Loading safetensors checkpoint shards: 100% Completed
(RayWorkerProc pid=16845) (Worker pid=16845) [parallel_state.py:1410] world_size=1 rank=0 ...
(RayWorkerProc pid=16845) (Worker pid=16845) Model loading took 14.29 GiB memory and 6.37 seconds
关键变化点如下
Connecting to existing Ray cluster at address: 172.31.40.36:6379:vLLM 通过/tmp/ray/ray_current_cluster自动找到了 GCS,不需要RAY_ADDRESS环境变量;如果这台机器上没跑ray start --head,这里会变成"启动一个新的本地 Ray cluster"No current placement group found. Creating a new placement group:即使 TP=1,vLLM 也走完整的 placement group 申请流程,申请 1 个 GPU+1 个 CPU 的 bundle- 日志前缀从
(EngineCore pid=...)变成(RayWorkerProc pid=16845) (Worker pid=16845):模型加载、parallel_state 初始化、forward 全部搬到了 Ray Worker actor 的独立进程里,不再是 EngineCore 进程内
Ray 视角的验证:
$ ray status
...
Total Usage:1.0/1.0 GPU (1.0 used of 1.0 reserved in placement groups)^^^^^^^^^^^^^^^^^^^^^^^^^^^^^^^^^^^^^^^^^^^^^^$ ray list actors --limit 5
======== List: 2026-05-25 07:46:25 ========
ACTOR_ID                          CLASS_NAME     STATE    PID    NAME
ef2a0e36da852ba02a7613a502000000  RayWorkerProc  ALIVE    16845  vllm_Worker_1779695043995214498$ ray list placement-groups
======== List: 2026-05-25 07:46:28 ========
PLACEMENT_GROUP_ID                    NAME      STATE
29231973226e40db2a36c9848d0002000000            CREATED
1.0 used of 1.0 reserved in placement groups 这一行就是 mp vs ray 部署最直接的区分点 :默认 mp 模式下 GPU 是普通 task 占用(reserved in placement groups 那项是 0),ray 模式下走 PG bundle。ray list actors 看到的 RayWorkerProc / vllm_Worker_xxx 也是 ray 模式独有。
进程树也能直观看出多了 RayWorkerProc:
$ pstree -p $(pgrep -f 'vllm serve' | head -1)
bash───vllm───VLLM::EngineCore───{30+ threads}    # driver/API + EngineCore# RayWorkerProc 是 Ray 单独 fork 的 16845
启动时间对比(同一台机,模型权重已在 page cache,torch.compile 缓存命中):
mp(默认):~50 秒ray(本验证):~75 秒
慢的 25 秒来自 ray.init() 连集群、placement group gang-scheduling 协商、RayWorkerProc actor 创建和 IPC handle 传递。
后文保持 ray 模式继续测压力
Prometheus 配置
先用 Ray 内置命令拉起 Prometheus:
ray metrics launch-prometheus
这行命令实际上会让 Ray 自动从 GitHub 下载 prometheus-3.11.3.linux-amd64.tar.gz,解压到 cache 目录,然后用模板配置启动。--web.enable-lifecycle 是关键,允许 POST /-/reload 触发热加载。
prometheus-3.11.3.linux-amd64/prometheus
--config.file /opt/pytorch/lib/python3.12/site-packages/ray/dashboard/modules/metrics/export/prometheus/prometheus.yml
--web.enable-lifecycle
启动时的初始配置只有 ray job:
global:scrape_interval: 10sevaluation_interval: 10s
scrape_configs:
- job_name: 'ray'file_sd_configs:- files:- '/tmp/ray/prom_metrics_service_discovery.json'
查 /api/v1/targets,3 个 ray endpoint 全 UP:
ray http://172.31.40.36:42039/metrics up
ray http://172.31.40.36:44217/metrics up
ray http://172.31.40.36:44227/metrics up
3 个端点对应 head 节点上 raylet、autoscaler、dashboard 各自的 metrics agent
下一步给 Prometheus 加 vLLM job。最干净的做法是直接改 Ray 已经启动的那个 prometheus 的配置文件,然后热加载(用户原文档让另起一个 prometheus 进程指向自定义路径,会和现有进程端口冲突):
sudo tee /opt/pytorch/lib/python3.12/site-packages/ray/dashboard/modules/metrics/export/prometheus/prometheus.yml > /dev/null << 'EOF'
global:scrape_interval: 10sevaluation_interval: 10sscrape_configs:- job_name: 'ray'file_sd_configs:- files:- '/tmp/ray/prom_metrics_service_discovery.json'- job_name: 'vllm'metrics_path: '/metrics'static_configs:- targets: ['localhost:8000']honor_labels: true
EOF# 触发热加载
curl -X POST http://localhost:9090/-/reload
honor_labels: true 是细节项 :vLLM 暴露的指标已经带 model_name 等 label,不希望 Prometheus 给它加 instance label 覆盖。
热加载后等 3-5 秒(Prometheus 加载是异步的,立刻查可能还没生效),再查 targets 就有 4 个:
 压测验证 vLLM 指标真的入库(同时也能看出本机的吞吐上限)。用 vLLM 自带的
 vllm bench serve,dataset 选 random 不需要外部数据集文件:
vllm bench serve \--model /data/model/Qwen2.5-7B-Instruct \--host localhost --port 8000 \--dataset-name random \--random-input-len 256 \--random-output-len 256 \--random-range-ratio 0.5 \--num-prompts 1000 \--max-concurrency 64 \--request-rate 64 \--seed 42
参数选择理由:
--random-input-len 256+--random-range-ratio 0.5:输入长度在[128, 384]随机,模拟真实变长 prompt--num-prompts 1000:总 1000 请求,足够 Prometheus 累出多个 scrape 周期的趋势曲线--max-concurrency 64:同时在飞 ≤ 64 个请求,闭环压力--request-rate 64:目标 RPS,配合 Poisson 到达过程--seed 42:复现同样的 prompt 序列
L4 24GB 上 Qwen2.5-7B BF16 + KV cache 8192 上下文跑出来的真实结果(用 Ray-backed executor 时,纯 mp 会快几个百分点):
- Output throughput 687 tok/s, peak 904 tok/s :L4 BF16 7B 的 decode 上限
- Median TPOT 89 ms :单 token 解码 89ms,约 11 tok/s/req
- TTFT p50 325 ms vs p99 3290 ms :长尾差 10 倍,说明 prefill 队列在 64 并发下偶尔积压;如果业务对 p99 TTFT 敏感,要么降
--max-concurrency,要么加更多 GPU - 0 failed requests :1000 请求全成,KV cache + scheduler 撑得住
============ Serving Benchmark Result ============
Successful requests:                     1000
Failed requests:                         0
Maximum request concurrency:             64
Request rate configured (RPS):           64.00
Benchmark duration (s):                  371.27
Total input tokens:                      256768
Total generated tokens:                  255167
Request throughput (req/s):              2.69
Output token throughput (tok/s):         687.29
Peak output token throughput (tok/s):    904.00
Peak concurrent requests:                72.00
Total token throughput (tok/s):          1378.89
---------------Time to First Token----------------
Mean TTFT (ms):                          444.01
Median TTFT (ms):                        324.98
P99 TTFT (ms):                           3290.06
-----Time per Output Token (excl. 1st token)------
Mean TPOT (ms):                          88.55
Median TPOT (ms):                        89.31
P99 TPOT (ms):                           94.31
---------------Inter-token Latency----------------
Mean ITL (ms):                           88.44
Median ITL (ms):                         72.79
P99 ITL (ms):                            228.47
==================================================
压测时另开一个终端实时看 Prometheus 抓到的 vLLM 指标:
# 当前并发请求数
curl -s 'http://localhost:9090/api/v1/query' \--data-urlencode 'query=vllm:num_requests_running' \| python3 -c 'import sys,json; d=json.load(sys.stdin); \[print(r["metric"].get("model_name","?"), "->", r["value"][1]) for r in d["data"]["result"]]'# 累计成功请求数
curl -s 'http://localhost:9090/api/v1/query' \--data-urlencode 'query=vllm:request_success_total'# 1 分钟窗口内的 token 吞吐
curl -s 'http://localhost:9090/api/v1/query' \--data-urlencode 'query=rate(vllm:generation_tokens_total[1m])'
压测结束后,所有指标在 Grafana 的 vLLM dashboard 里能看到完整的曲线:请求并发、TTFT/TPOT 分布、KV cache 利用率、GPU 利用率等。这是验证整条链路(vLLM /metrics → Prometheus 抓取 → Grafana 渲染)端到端通的最直接方式。
Grafana 安装
通过 Grafana 官方 APT 仓库装 OSS 版
sudo apt-get install -y apt-transport-https software-properties-common wget
sudo mkdir -p /etc/apt/keyrings/
wget -qO - https://apt.grafana.com/gpg.key \| sudo gpg --dearmor -o /etc/apt/keyrings/grafana.gpg
echo "deb [signed-by=/etc/apt/keyrings/grafana.gpg] https://apt.grafana.com stable main" \| sudo tee /etc/apt/sources.list.d/grafana.listsudo apt-get update -qq
sudo apt-get install -y grafanasudo systemctl daemon-reload
sudo systemctl enable --now grafana-server
启动后健康检查:
$ curl http://localhost:3000/api/health
{"database": "ok","version": "11.x.x","commit": "..."
}
vLLM 的 Dashboard 导入
通过 Grafana HTTP API 加 Prometheus datasource:
curl -u admin:admin -X POST http://localhost:3000/api/datasources \-H 'Content-Type: application/json' \-d '{"name":"Prometheus","type":"prometheus","url":"http://localhost:9090","access":"proxy","isDefault":true}'
返回 {"datasource":{"id":1,"uid":"efn3gduzyadc0f",...},"message":"Datasource added"}。
导入 vLLM 官方 dashboard,路径是 examples/observability/prometheus_grafana/grafana.json。下载并通过 Grafana API 导入:
curl -sL -o /tmp/vllm-grafana.json \https://raw.githubusercontent.com/vllm-project/vllm/main/examples/observability/prometheus_grafana/grafana.jsoncat /tmp/vllm-grafana-import.json
{"dashboard": d,"overwrite": True,"folderId": 0,"inputs": [{"name": "DS_PROMETHEUS","type": "datasource","pluginId": "prometheus","value": "Prometheus"}]
}curl -u admin:admin -X POST http://localhost:3000/api/dashboards/import \-H 'Content-Type: application/json' \-d @/tmp/vllm-grafana-import.json
返回 {"uid":"b281712d-8bff-41ef-9f3f-71ad43c05e9b","title":"vLLM","imported":true,...}。这个 dashboard 含 12 个 panel,覆盖请求速率、队列深度、TTFT、TPOT、KV cache 利用率、GPU 利用率、token 吞吐等关键指标。

Ray 自带 Dashboard 导入
Ray 自己带了一整套 dashboard,跟着 ray 包一起装好,路径在 <ray pkg>/dashboard/modules/metrics/dashboards/。这套 dashboard 是给 Ray Dashboard /api/grafana_health 里那 7 个 UID 用的。
ray start 时会基于本集群信息把 base 模板渲染成完整 JSON,写到 session 目录下:
$ ls /tmp/ray/session_latest/metrics/grafana/dashboards/
data_grafana_dashboard.json              # 18 panels - Ray Data
data_llm_grafana_dashboard.json          # 12 panels - Ray Data + LLM
default_grafana_dashboard.json           # 42 panels - Cluster overview
serve_deployment_grafana_dashboard.json  # 15 panels - Serve per-deployment
serve_grafana_dashboard.json             # 22 panels - Serve aggregate
serve_llm_grafana_dashboard.json         # 40 panels - Serve LLM 专用
train_grafana_dashboard.json             #  5 panels - Ray Train
每份 JSON 都带 Ray 期望的 UID(如 default_grafana_dashboard.json 内 "uid": "rayDefaultDashboard"),所以直接 POST 到 Grafana /api/dashboards/import 就行,不需要改 UID 或 datasource:
#!/bin/bash
DIR=/tmp/ray/session_latest/metrics/grafana/dashboardsfor f in "$DIR"/*.json; dojq '{dashboard: (. | .id = null),overwrite: true,folderId: 0,inputs: [{name:"DS_PROMETHEUS",type:"datasource",pluginId:"prometheus",value:"Prometheus"}]}' "$f" \| curl -s -u admin:admin \-X POST http://localhost:3000/api/dashboards/import \-H "Content-Type: application/json" \-d @- \| jq -r '.uid + " imported=" + (.imported | tostring)'
done
查看dashboard导入

检查Grafana的dashboard指标

访问 URL
实例公网 IP public_ip,开放给浏览器的端点如下
- Prometheus UI: http://public_ip:9090
- Grafana UI: http://public_ip:3000(admin / admin)
- vLLM Dashboard: http://public_ip:3000/d/b281712d-8bff-41ef-9f3f-71ad43c05e9b/vllm